Predicting Cancer Category
Heathcare
Jul. 25, 2018
Overview
Categorizing tumor types using over thirty independent descriptors from medical reports by using best clustering algorithm amongst Gaussian Naive Bayes, Decision Tree, and Random Forest, Achieved 96.26% accuracy
Description of Data
- Cancer Data Set has 8 different features which are computed from a digitized image of a fine needle aspirate (FNA) of a breast mass
- Ten real-valued features are computed for each cell nucleus
- Data set is composed of the mean, standard error and the “worst” of the above attributes
- Data set contains patient ID number, and Diagnosis (M = malignant, B = benign)
Project Details
Analyzing Data
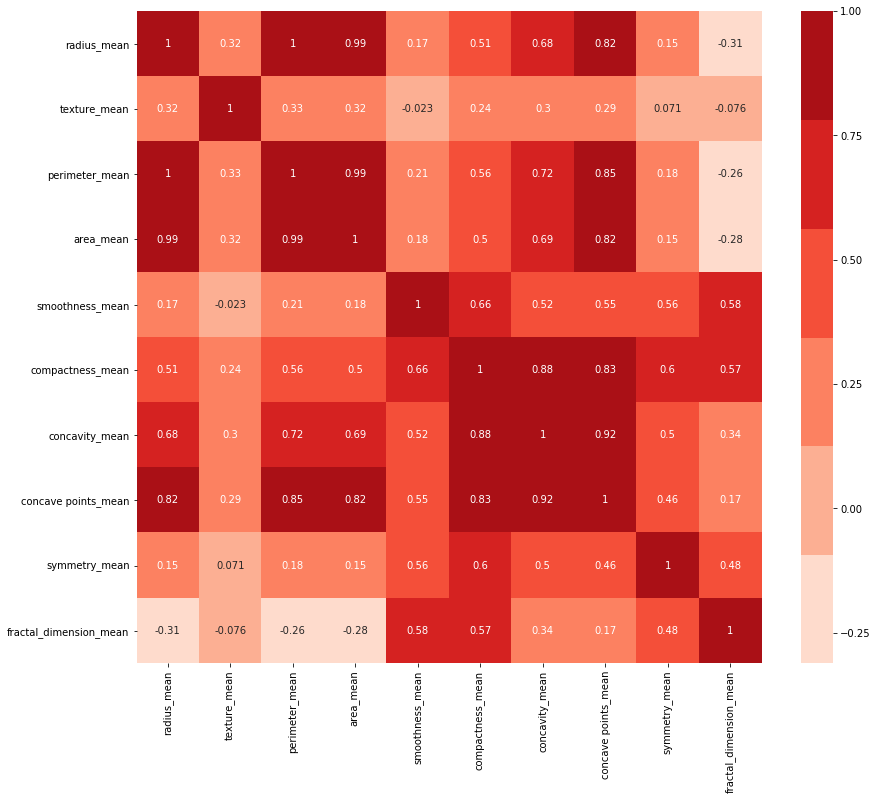
- Correlated variables
- Radius, Parameter, Area
- Concavity, Compactness and Concave points_mean
- Identified independent variable by elimination correlated variables in order to avoid overfitting
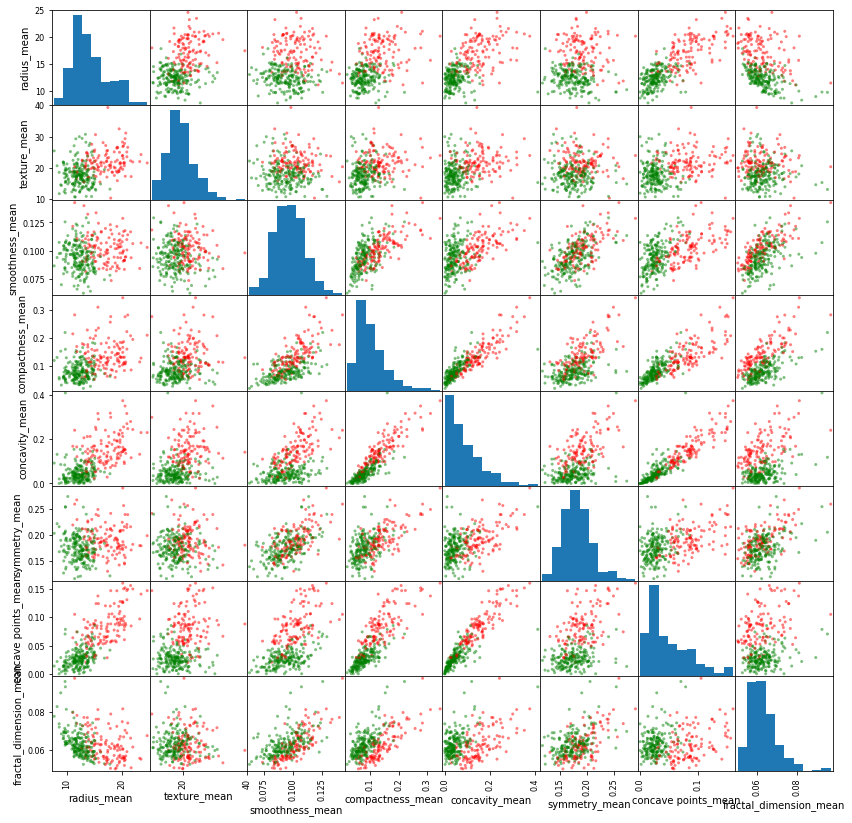
- Overlapping variables
- Fractal Dimension
- Symmetry Mean
- Eliminate overlapping variables from the model
Creating a Model
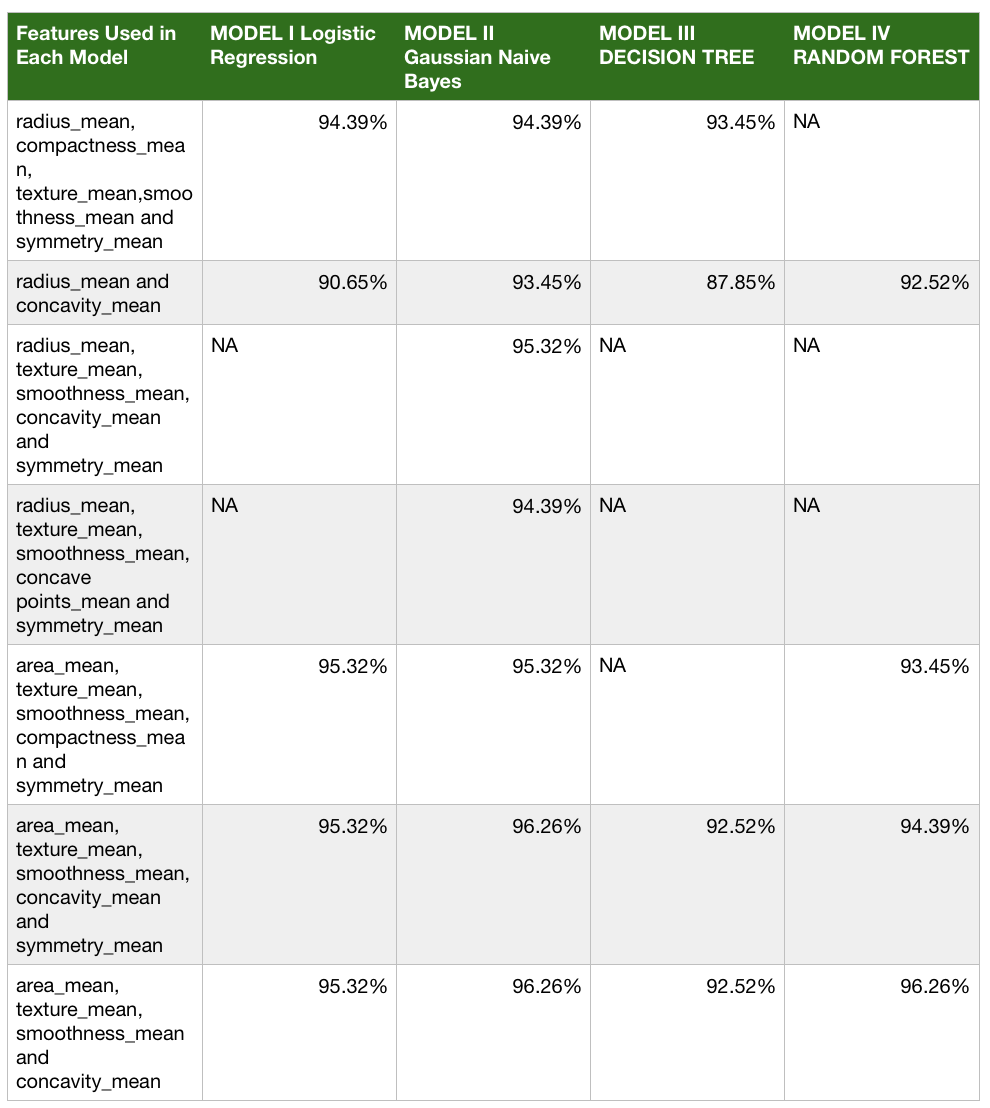
Created different Models to test which gives highest accuracy score with narrowed features:
- Decision Tree
- Random Forest
- Multiple Logistic Regression
- Gaussian Naive Bayes
Gaussian Model Benefits:
- Easy and fast to predict class of test data set.
- Performs well in multi class prediction
- When assumption of independence holds, a Naive Bayes classifier performs better compared to other models like logistic regression using less training data.
Validation Result
- Training Data
- R2 value : 0.705126
- Mean Absolute Error : 0.0689
- Testing Data
- R2 value : 0.83474
- Mean Absolute Error : 0.03738
- Both the measures improved on the test data, as R2 got closer to 1 , and the MAE reduced in size.
- Confusion Matrix:
| Predicted | False | True |
|---|---|---|
| 0 | 69 (True Negative) | 1 (False Positive) |
| 1 | 3 (False Negative) | 34 (True Positive) |
Gaussian Model Result Explanation:
- The model exemplifies that the 4 features used (area, texture, smoothness, concavity) can be used to predict diagnosis with the caveat that they are assumed to be independent
Visualization Of Simple Gaussian Naive Bayes
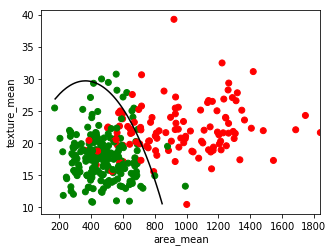
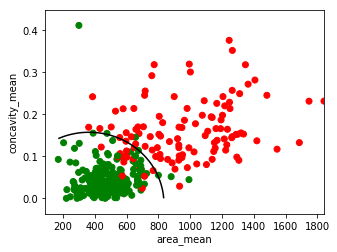
- A decision boundary computed for features from the model using Gaussian naive Bayes classification. The line shows the decision boundary, which corresponds to the curve where a new point has equal posterior probability of being part of each class
- We see a slightly curved boundary in the classifications—in general, the boundary in Gaussian naive Bayes is quadratic
- Final Model is function of these individual probabilities
Random Forest First Estimator Visualization
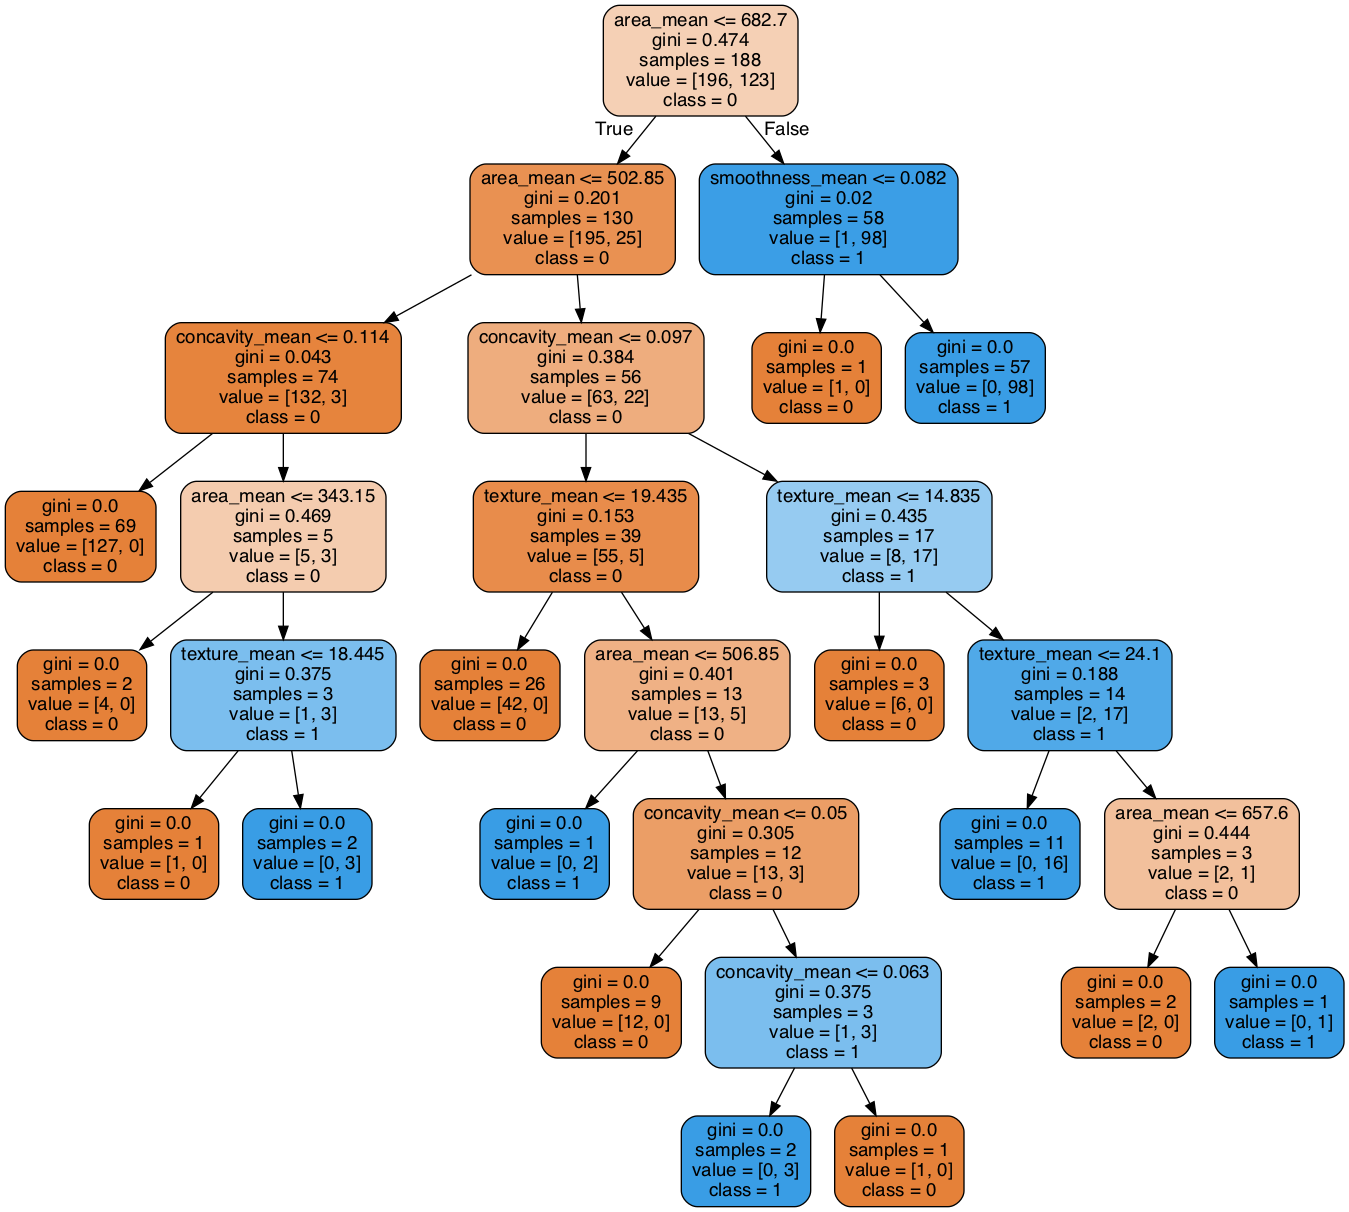
- Random Forest is built using multiple Decision Trees.
- Random Forest can measure the relative importance of any feature in a classification task.
- The value numbers returned from forest correspond to the importance of the feature in the classification task.
Learnings and Findings
- FNA visual interpretation technique coupled with the Machine learning model can predict cancer diagnosis with 96% accuracy, helping start treatment at earliest possible time
- Importance of knowing the data